Page
Using Specialised Gantt Charts for Monitoring
Completion requirements
View
Click here to view a video on how to make a Basic Gantt Chart in Microsoft Excel 2016.
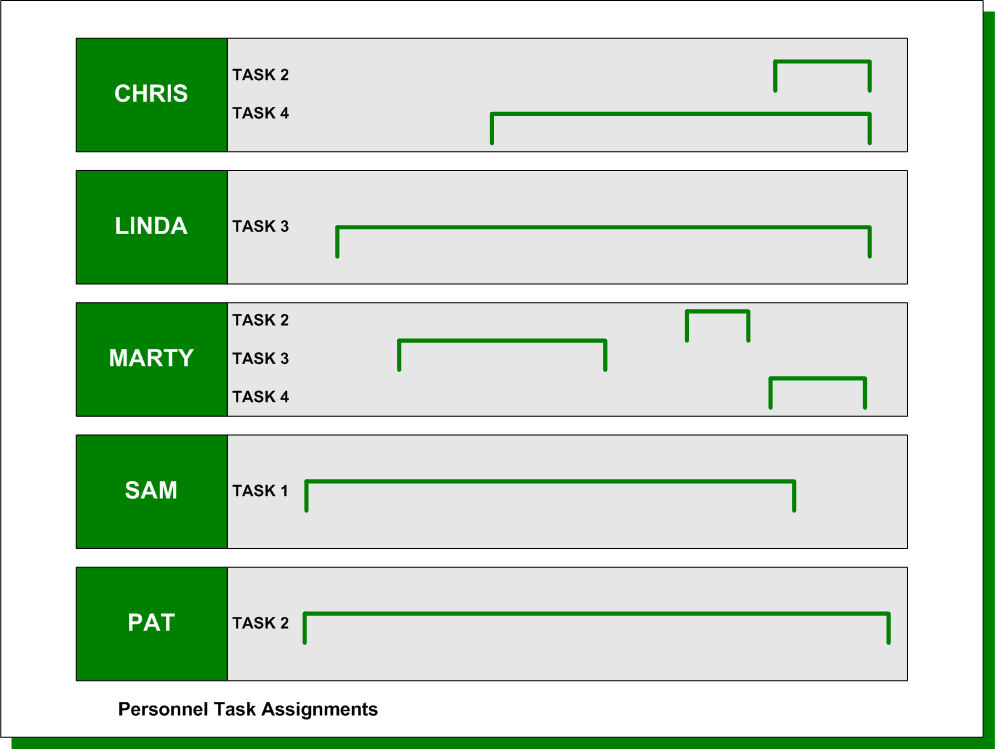
Once the Gantt chart is constructed, it can be used to integrate information about the projected use of time with information about the projected use of other resources. Two types of integrated Gantt charts are commonly used. The first shows personnel task assignments. By listing each individual along the vertical axis, followed by all the tasks/activities, then followed by all the tasks/activities to which that individual is assigned, the project manager can see at a glance which tasks/activities each person is assigned to at each time period of the project. If the task distribution across individuals is uneven or if some individuals were mistakenly given too many work assignments during a single time period, this chart gives the project manager another chance to redistribute task assignments.
The second type of integrated Gantt Chart is the Bar Chart Cost Schedule. This Gantt Chart simply shows the projected performance to be spent in each time period. It also allows the project manager to calculate the cost slope by dividing the cost of the activity by the duration of the activity (in whatever unit of time is being used). Thus, if Activity A costs R4,500 and is expected to take three weeks to complete, the cost slope in rand per week is R1,500. While this piece of information is not interesting in isolation, it becomes interesting when the project manager compares it to the cost slopes of other activities, because it gives a sense of the relative cost of activities per time period.
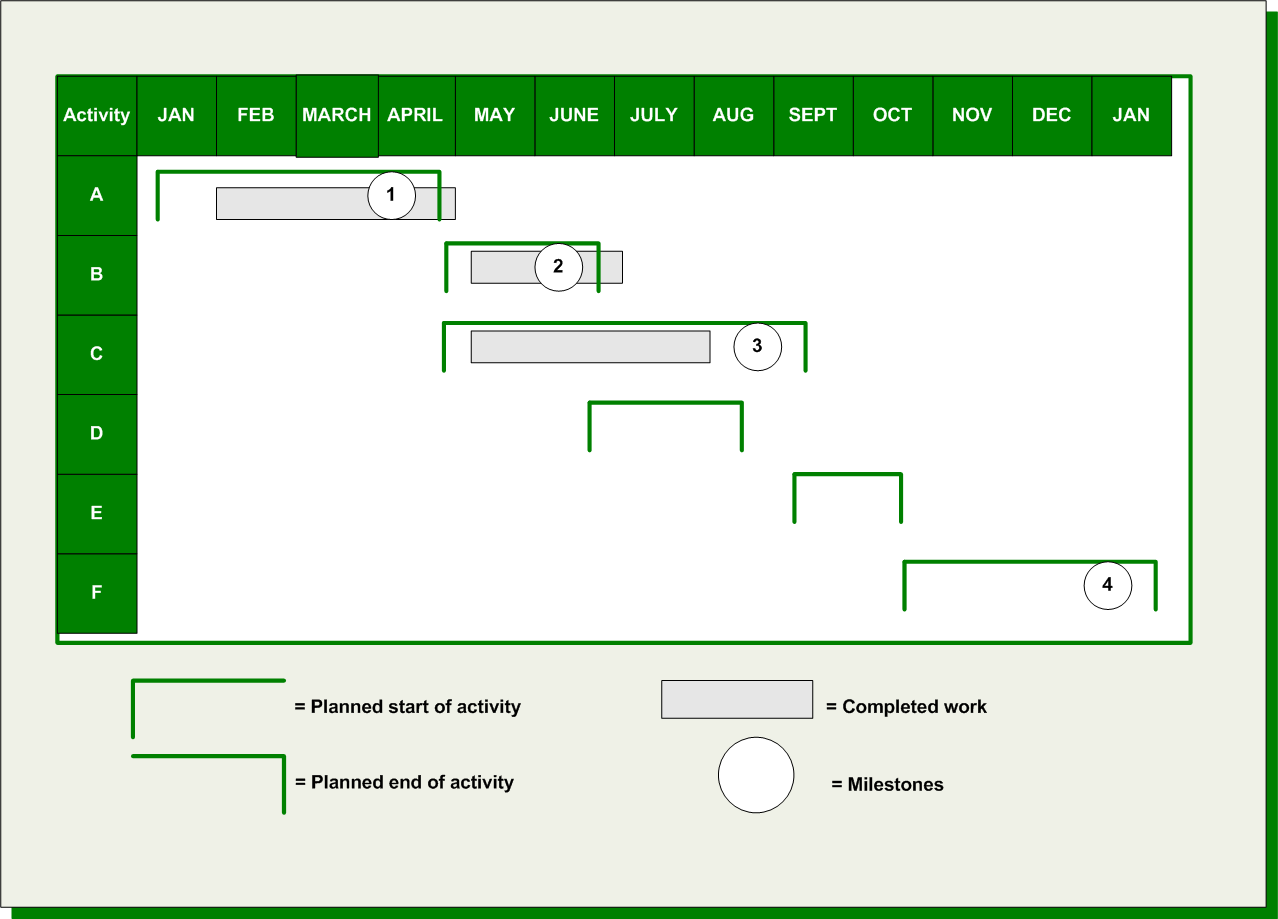
Gantt Charts as Monitoring Tools.
The Gantt chart is also a useful project-monitoring tool. By using different colours or different symbols, the Gantt chart can help the project manager to track down how close the project is performing to the planned schedule. When a given task runs in excess of the allotted time, the Gantt chart can be used to determine whether or not the schedule needs to be re-arranged. The figure below shows that Activity A and B ran over schedule approximately one week each, whereas Activity C was completed almost one month ahead of schedule.