Page
Using a Human Resource Matrix to Monitor Utilisation of People
Completion requirements
View
One final planning/monitoring tool is the human resource matrix. As with the Gantt chart used to show the personnel task assignments, this matrix can be used to see whether the workload is evenly distributed across individuals. The human resource matrix lists the tasks/activities along the vertical axis and the names across the top of the metrics (see Figure). For each task/activity, one person is designated to have primary responsibility (P), and others may be designated to have secondary responsibility (S).
|
TASK |
CHRIS |
LINDA |
MARTY |
PAT |
SAM |
|
1 2 3 4
|
S
P |
P |
S S S |
P C C C |
P |
Other designations can also be added as needed. For example, one can label an individual as (C) if that individual needs to be consulted; or (B) if a person can provide backup, and so on. Project teams need to be able to adapt the project management tools to meet their needs best.
One advantage of this chart above the personnel task assignment chart is that it makes it clear whether or not time spent on the project is time in a leadership capacity. Further, it makes it clear at a glance whether someone has too many leadership (primary) assignments. Alternatively, while it reveals who is assigned to which task/activity, it is not as informative as the personnel task assignment chart with respect to how much time is being spent during each time by each person. Therefore, it is probably wise to use the two charts together for keeping track of how human resources are being utilised.
Controlling the Project Budget
While project success is generally defined in terms of project completion within constraints of time and cost, and at an appropriate level of performance, the project manager will be rated a success or failure as a project manager according to whether the project comes in under budget, on budget, or over budget.
Monitoring Cost Variances and Cost/Schedule/Integration
In monitoring the budget, the project manager is concerned with two types of information. The first involves the amount of money budgeted for the work to be performed (budgeted cost of work performed – BCWP) versus the actual cost of performing the work (actual cost of work performed – ACWP). The difference between the two quantities (BCWP-ACWP), called the cost variance, is an indication of how close the estimated cost was to actual costs, with a positive number indicating monetary savings and a negative number indicating a budget overrun.
The second type of information involves the amount of money projected to be spent on the actual work performed during the time period (budgeted cost of work performed – BCWP) versus the amount projected to be spent during the time period (budgeted cost of work schedule–BCWS). The difference between the two quantities, (BCWP – BCWS), called the schedule variance, is an indication of whether the money is being spent according to the projected scheduler.
Here a positive number is an indication that the project is running ahead of schedule – that is, more work is being performed than was originally scheduled – whereas a negative number is an indication that the project is running behind schedule – less work is being performed than was actually scheduled. Alternatively, a negative number could be an indication that some work is being performed out of its scheduled sequence. Schedule variance should be examined in conjunction with the Gantt chart or PERT/CPM network diagram to determine the actual status of specific activities or milestones.
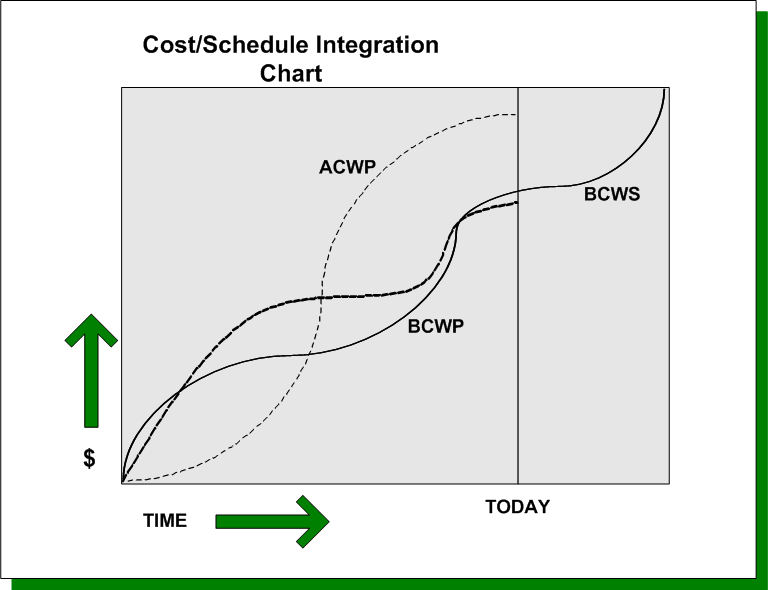
Cost and schedule variances can be examined graphically or in a table. To examine these variances graphically, the project manager needs to calculate cumulative BCWS, BCWP, and ACWP at each time period. It means that for each reporting period (usually monthly) the project manager needs to calculate the total projected budget for the work that has actually been performed up to that time period (cumulative BCWP), and the total budget actually spent up to that time period (cumulative ACWP). The three amounts are plotted at each time period along the vertical axis, with time across the horizontal axis. The points are then connected to make a smooth curve (see Figure). Note, that the cumulative BCWS curve extends from the lower-left corner, where no money has been budgeted to be spent before the beginning of the project, to the upper-right corner, where all the money is budgeted to be spent by the end of the project.
When the cumulative BCWS curve lies above the cumulative ACWP curve, the project is running under budget. Alternatively, if the cumulative ACWP lies above the cumulative BCWP curve, the project is running over budget and the project manager needs to understand shyness. Similarly, if the cumulative BWCS lies below the BCWP, then the project may well be running ahead of schedule. Alternatively, if the BCWS lies above the BCWP, the amount that the project manager expected to spend up to that time period is less than the amount actually being spent, and the project may be behind schedule. In the figure below, the project was initially running under budget but is now running considerably over budget. It was also initially behind schedule but is catching up.
A performance analysis report presents cost and schedule variance in a tabular form. This report is usually generated on a monthly basis, although, depending on the complexity of the project, it could be done more or less often. The report includes two tables, one with the information above performance in the current time period and the second with information about cumulative performance. The first table presents five pieces of information for each category of expenditure:
- The amount budgeted for this time period (BCWS).
- The amount budgeted for the work performed (BCWP).
- The amount actually spent in the current time period (ACWP), cumulative information.
Again, the project manager should be concerned when the performance analysis report indicates negative cost or schedule variances.