Page
Promoting Learner Interaction Through Facilitation
Completion requirements
View
Click here to view a video that explains the activating of learners in a student-centered classroom.
Visualisation: “When” and “Where” do we Visualise?
The answer is simple: at every facilitated workshop, event or meeting!
“People remember 20% of what they hear, but 40% of what they hear and see.” Visual aids, such as cards and posters, flipcharts, overhead transparencies, slides, power point presentations, etc. make workshops more efficient and more interesting for the group. They are an important means of facilitation.
It is essential for a facilitator to use visualisation to map out the discussion from start to finish. It is not to be mistaken with the minutes of a meeting, which are brought into form after the meeting has concluded. The parallel visualisation of the discussion – from the concrete targets to be reached, through the decisions and thought processes along the way, right up to the “to do's” which close the meeting – will keep your learners on track and give you as facilitator the logical guidelines and justification to steer the discussion in the right direction.
What do we visualise?
- Title, goals, agenda
- Basic timeline of the workshop and of the process
- Content and the logical development of the discussion
- Ground rules
- Questions and tasks
- Break-away groups’ tasks and structure for their group work
- Yourself!
Materials for Visualisation
(Metaplan) pin-boards (roughly 120 x 150cm pin-board size on legs), such as are used in the training are ideal for visualisation. They are light and versatile and allow the facilitator to write directly onto the brown papers or to use cards and pin them to the board, thus creating a flexible and dynamic background for the structuring of the discussion. However: they are not always available. Facilitators can also use the same principle of the boards using sticky tape and pieces of paper on the room’s wall, or by placing papers or cards on the floor and conducting “horizontal” visualisation (be careful of drafts blowing everything around!).
A handy visualisation partner is also the flipchart, although it is wise to post key flipchart pages on to the walls so that simultaneous visualisation is also possible here and results or key questions are not lost when the pages are flipped over.
Anything visual is allowed and encouraged! Use trees, photographs, natural objects, the positioning of learners in the room and yourself to provide a visual accompaniment to the verbal facilitation.
Top Down or Networked
Hierarchical structures showing relationships or connections between ideas and opinions are key methods of visualisation. Either work your way from small to big (details to major themes) or create titles under which details can be clustered. A tree structure or mapping is useful to show the logical and associative connection between related topics as well as anchoring the entire issue as one “big picture” in the brain of the participant.
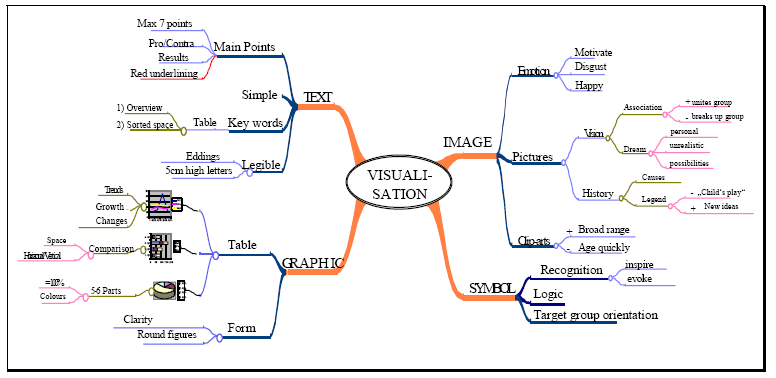
Colour and Form
People take in more if they like what they are looking at. The didactic value of content is thus strongly connected with the aesthetical pleasure, interest or empathy it evokes. Think about pictures and decent decorations. Underline important points in red ink or circle key words in blue. This is a sure way to steer a group of learners to the major issues and reach results at the end of the meeting.