Page
The Use of Critical Path Method to Map Project Duration During WBS
Completion requirements
View
The WBS provides information on the estimated time of completion for each individual activity, but it does not indicate the order in which the activities can or will take place. It does not indicate whether Activity A must be completed before Activity B can proceed, or whether the two can proceed concurrently. When a project is fairly simple, these interrelationships are not difficult to discern, and a schedule can be constructed directly from the WBS by laying out the activities in the order in which they are to be carried out. Alternatively, when a project is complex, it is almost impossible to construct a schedule before the interrelationships among the various activities are made explicit. Network diagrams are graphical tools for making these interrelationships explicit. Until recently, the most popular network diagramming techniques have been Program Evaluation and Review Technique (PERT) and Critical Path Method (CPM).
PERT was introduced by the Special Project Office of the United States Navy in 1958 as an aid in planning (and controlling) its Polaris Weapon System, a project that involved approximately 3,000 contractors. At virtually the same time, a similar technique, Critical Path Method (CPM), was introduced by the Du Pont Company. The methods are very similar and in essence show, the flow of activities from start to finish. Over the years, the two methods have essentially merged, and people often refer to PERT/CPM diagrams and/or analysis. More recently, with the increased use of project management computer software, other similar approaches have been developed and have gained some popularity and acceptance. Because the basic logic of the network diagramming is basically the same across the various techniques, the more traditional approaches will be presented.
As was implied above, PERT/CM diagrams allow the project manager to see the flow of tasks associated with a project by showing the interrelationships between activities. They allow the project manager to estimate the time necessary to complete the overall project, given the interdependencies among tasks; and to identify those critical points where a delay in task completion can have a major effect on overall project completion. In performing the PERT/CPM analysis, one assumes that all tasks or activities can be clearly identified and sequenced and that the time necessary for completing each task or activity can be estimated.
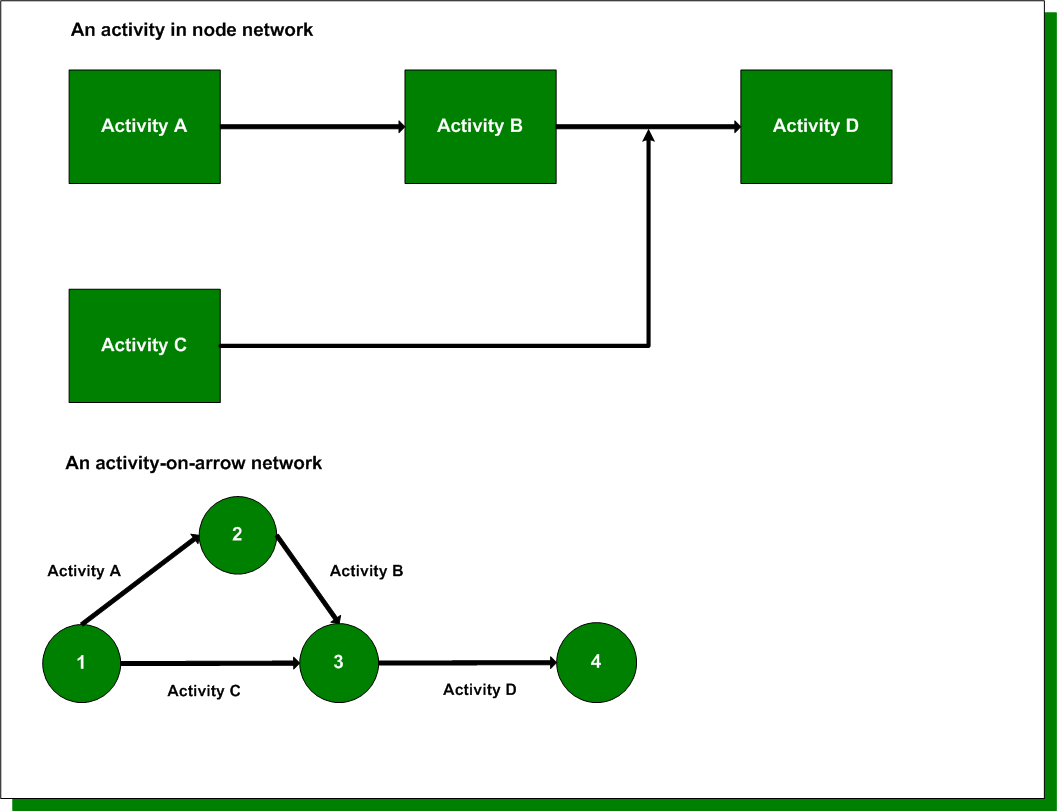
The figure above shows a simple PERT/CPM diagram. In the diagram, arrows designate activities. The circles at the beginning and end of the arrows are referred to as nodes; they designate starting and ending points for activities. These points in time, called events, consume no time in and of themselves. An activity is referred to as Activity i,j or Activity i-j, where i is the start node and j is the end node. Because of the way the diagram is constructed, the PERT/CPM diagram is sometimes referred to as an arrow or activity-on-arrow network diagram. Alternatively, activity-in-node (usually drawn in boxes) uses the arrows simply to show the necessary ordering of the activities. In activity-on-arrow diagrams, the numbers along the arrows indicate the expected time for the activity to be completed.
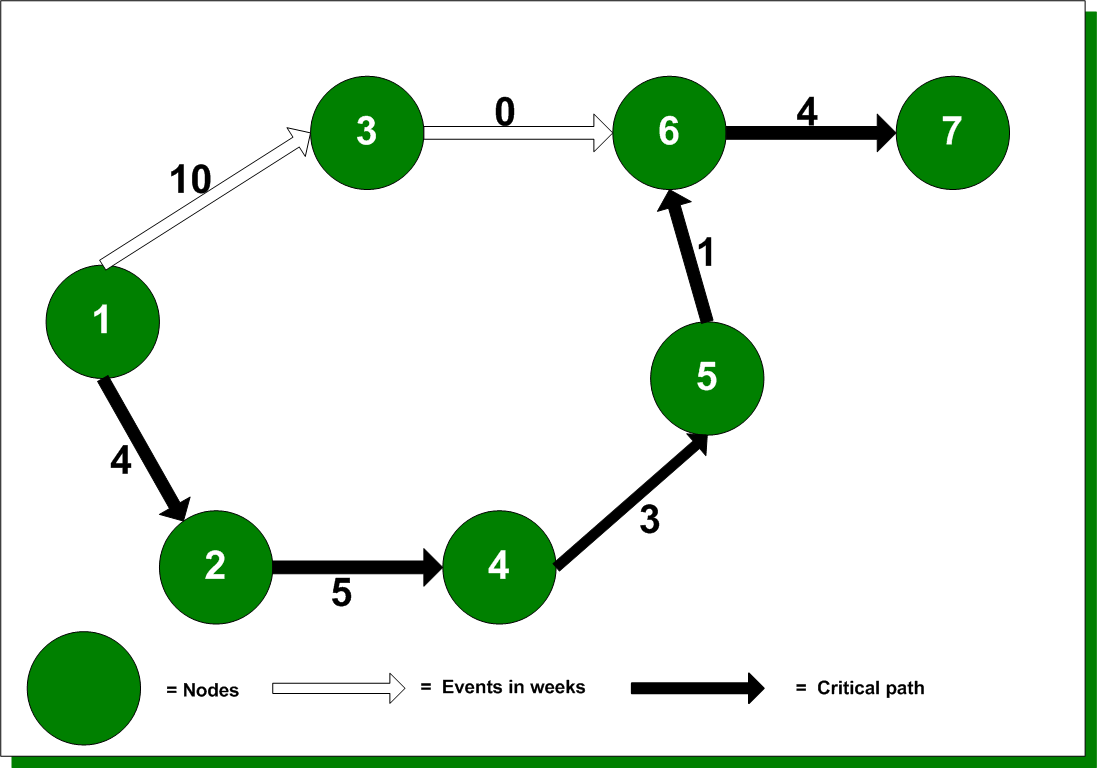
Note that Activity 3, and 6 have an expected time of zero weeks. This type of activity, called a dummy activity, is used to indicate that Activity 6, and 7 cannot begin until Activity 1, and 3 are complete.
The critical path is that chain of activities which takes the longest time to proceed through the network. It indicates the least possible time in which the overall project can be completed, and it is the path that needs to be watched most carefully to ensure that the project stays “on track”
To identify the critical path, it is necessary to understand the concept of slack or float. In the figure below, the critical path, 1-2-4-5-6-7, takes 17 weeks from start to finish. Note, however, that there is another path, 1-3-6-7, which only takes 14 weeks from start to finish. This means that Activity 1, and 3 could begin three weeks later than Activity 1, 2 and the project would still be completed on time, assuming, of course, that the time estimates are fairly accurate. It is then said that Activities 1, and 3 have a total float or slack of three weeks. While this is easy to see in the figure, it requires more effort when the diagram is more complex.
The first step in identifying the critical path is to identify the earliest start and finish times. Start at the first node of the diagram; this has the earliest start time of zero. For the other nodes, the earliest start time equals the earliest finish time of the previous activity. For all activities, the earliest finish time is the sum of the earliest start time plus the estimated time of activity.
Next, take the largest finish time for the last node and subtract the estimated time for completion of that activity from the latest finish time of the previous activity. To identify the critical path, make a list of the latest finish time and earliest start time. Time available is then calculated as the difference between the earliest start time and the latest finish time. If the available time is equal to the estimated time for completing the activity, there is no float and that activity is on the critical path.
As indicated above, the critical path is important because it is the path that must be most closely monitored. It is the path for which there is no slack, and activities must begin and end on time in order for the project schedule to be met. Alternatively, activities that are not on the critical path can begin any time between the earliest and latest start dates. The determination is usually in accordance with the availability of resources, primarily human resources.
Identifying the Critical Path
The table below shows the calculations as discussed:
|
ACTIVITY |
LATEST FINISH TIME (-) |
EARLIEST START TIME (-) |
TIME ESTIMATE |
(=) FLOAT |
|
1,2 |
4 |
0 |
0 |
0* |
|
1,3 |
13 |
0 |
10 |
3 |
|
2,4 |
9 |
4 |
5 |
0* |
|
3,6# |
13 |
10 |
0 |
3 |
|
4,5 |
12 |
9 |
3 |
0* |
|
5,6 |
13 |
12 |
1 |
0* |
|
6,7 |
17 |
13 |
4 |
0* |
* Critical path: # Dummy activity – has no time duration