Page
Statistics to Assist in the Analysis of the Income Statement
Completion requirements
View
Two commonly used statistical calculations which could assist with your projections, include the calculation of the mean/average, as well as the standard deviation:
The Arithmetic Mean
This is the most commonly used measure of central tendency and is often being referred to as the average or the mean. It is the sum of the values of a data set divided by the number of observations:
Calculation of a mean:
x ̃ = (∑x)/n
x ̃ = arithmetic mean
x = each observation value
n = number of observations
If you could, for example calculate the average net profit over the past 6 months, this could assist you to project profit for the following 6 months, provided all other variables stay unchanged.
Example:
Calculate the mean of the Net Profit of a company with a total net profit of R 490 676 over six months:
x ̃ = (∑x)/n
= ((490 676))/6
= (81 779.33)
Which means that the Company’s average Net Profit for the past 6 months was (81 779.33)
The Standard Deviation
The standard deviation is the most widely used measure of dispersion, and measures differences from the mean. To prevent negative deviations from the mean, cancelling positive deviations, the deviations are squared. The standard deviation is useful in statistics because:
- Most distributions in statistics is described by their mean and standard deviation
- The measuring unit is the same as the mean (Rands, minutes, metres, etc.)
- The larger the standard deviation, the larger the variation of data. A standard deviation of zero means there is no variation.
The calculation of the standard deviation:

Example:
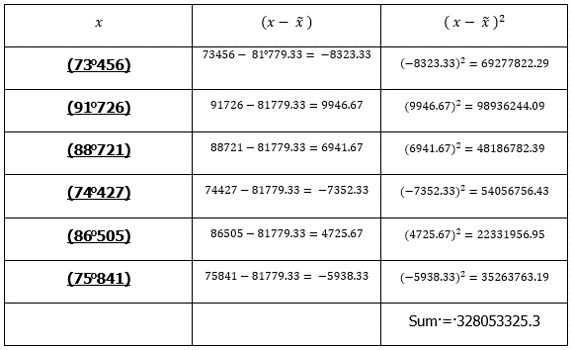

The Standard deviation means that (The larger the standard deviation, the greater the variation on profit from month to month, the smaller the standard deviation the more stable the profit)