Page
Selection of Animals to Improve Performance
Completion requirements
View
The Normal Curve
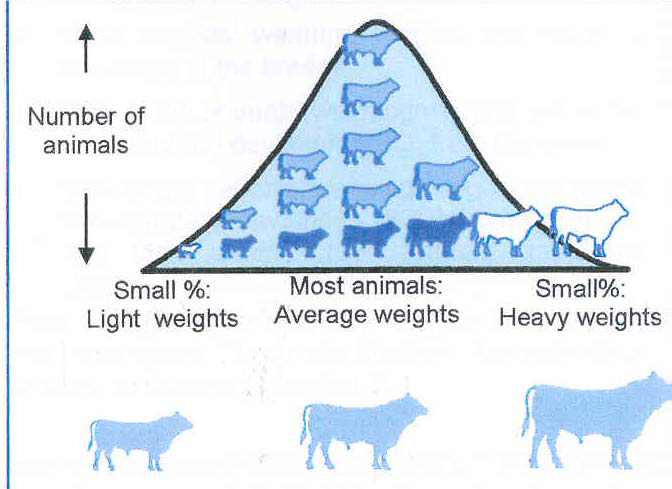
The so-called normal curve and selection: the normal curve is a graph that gives the variation for a certain trait among farm animals.
In a flock of merino sheep, there will be sheep that produce only one kilogram of wool per year and there will be sheep that produce 6 kg of wool per year. Then there will be a lot of sheep producing wool between 1 and 6 kg wool per year. The variation of wool production will therefore be between 1 and 6 kg of wool per year.
If you plot all the sheep’s production on a graph, then you will find that most of the sheep will produce around about 3.5 kg (the average wool production of the flock) of wool per year.
The curve will look like a clock and is called the normal curve.
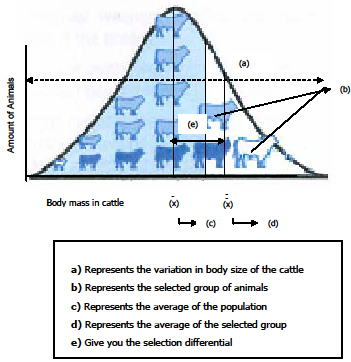
You can use this curve to select the animals that are superior, and you can work out the selection differential (that is the amount of difference), the average wool production or body mass will be higher in the selected group, than the average production of the sheep or cattle in the unselected population. Another example: Body size in cattle.
See cattle example:
The Importance of a Good Reproduction Rate in Farm Animals
To improve your flock, it is important to cull a few female and male animals every year.
The average reproductive lifetime of female animals is between five and seven years. If keeping in mind that an animal rarely reproduces in its first year, you will replace breeding stock at a rate of about 20% per year.