Page
Analysing and Presenting Research Findings
Completion requirements
View
Analysis is the process of finding out what your information means and what conclusions it will support. For survey information, item mean scores generally suffice. For behavioural indicators, such as absences and tardiness, frequency counts or percentages will do the job. These analyses are descriptive and comparable. You can use them to measure your progress from year to year.
Analysing quantitative and qualitative data is often the topic of advanced research and evaluation methods courses. However, there are certain basics which can help to make sense of reams of data.
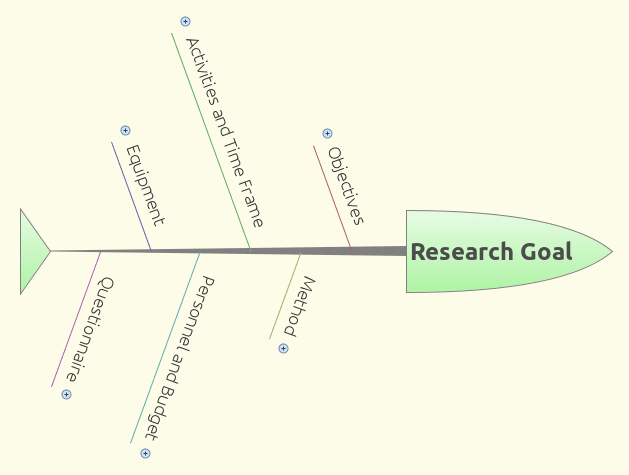
Always Start with Your Research Goals
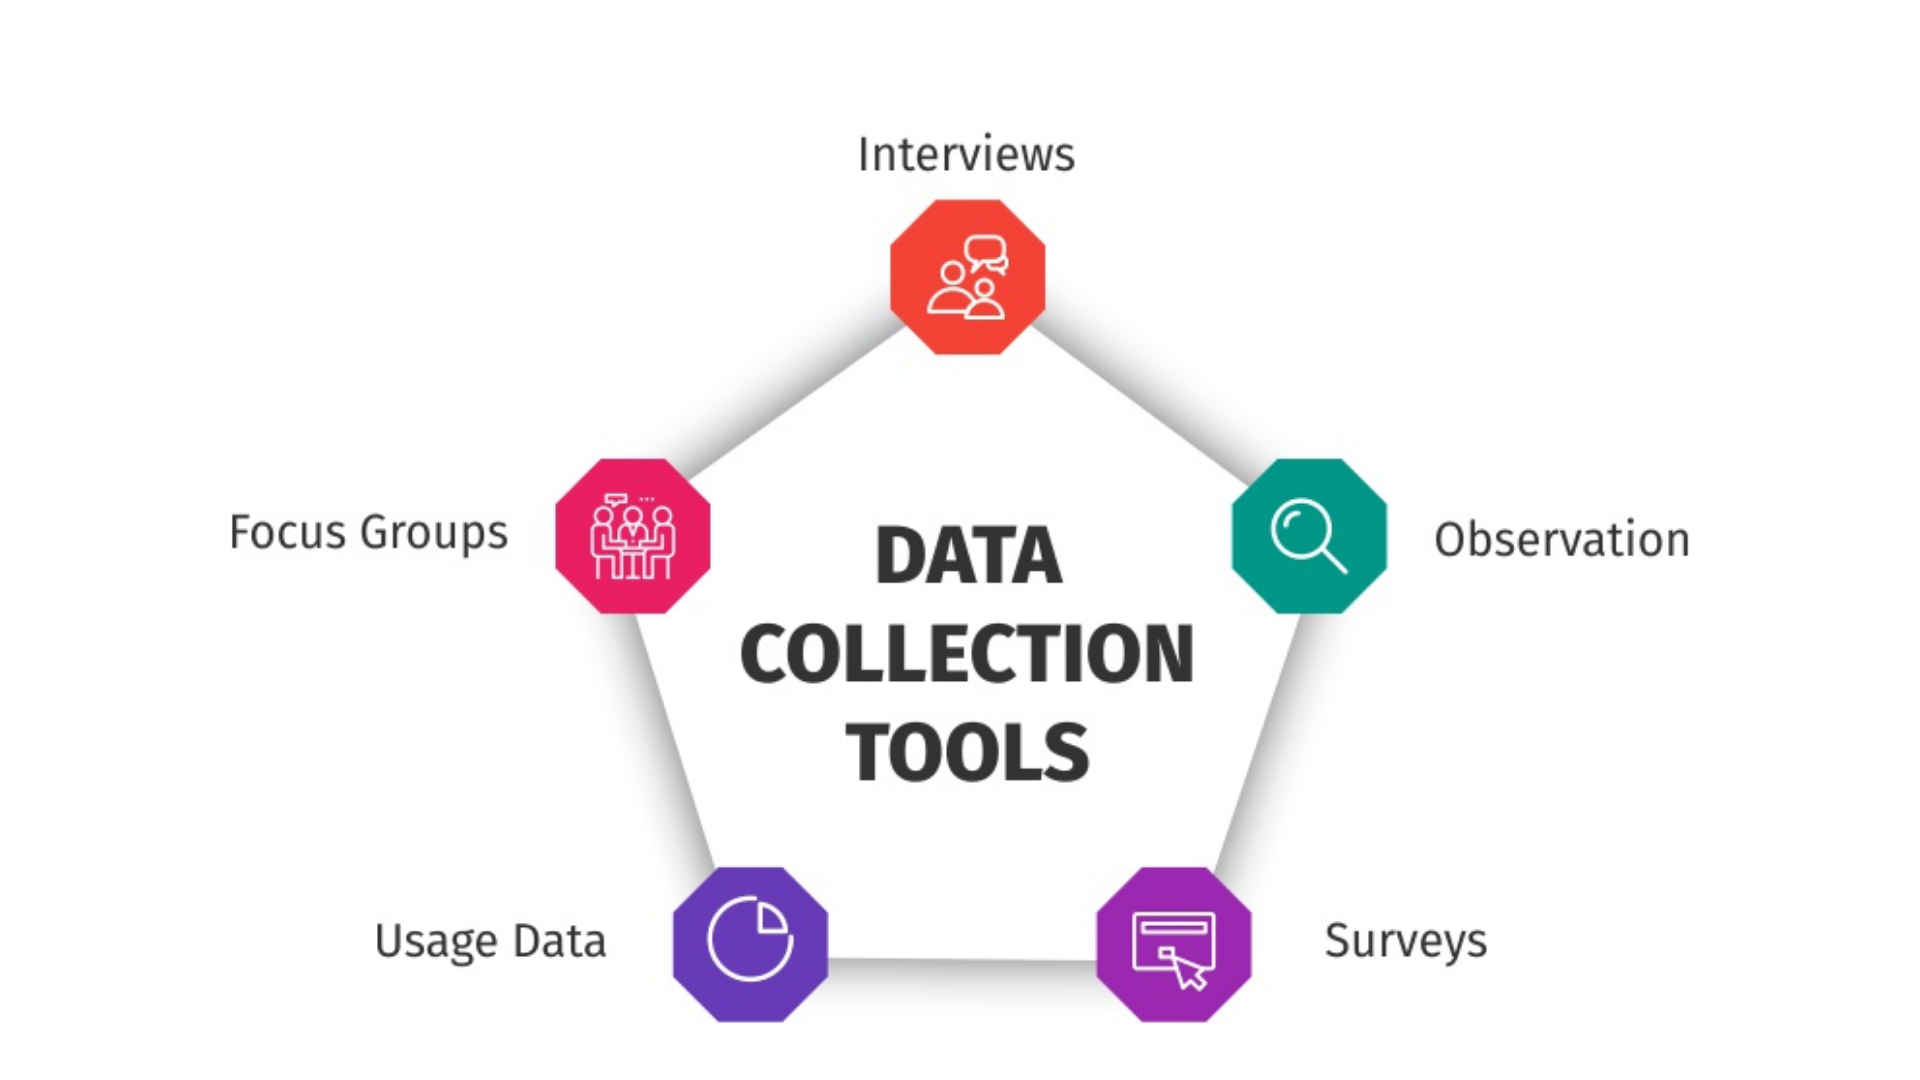
When analysing data (whether from questionnaires, interviews, focus groups, or whatever), always start from review of your research goals, i.e., the reason you undertook the research in the first place. This will help you organize your data and focus your analysis. For example, if you wanted to improve a program by identifying its strengths and weaknesses, you can organize data into program strengths, weaknesses and suggestions to improve the program. If you wanted to fully understand how your program works, you could organize data in the chronological order in which customers or clients go through your program. If you are conducting a performance improvement study, you can categorize data according to each measure associated with each overall performance result, e.g., employee learning, productivity and results.
Basic analysis of "quantitative" information (for information other than commentary, e.g., ratings, rankings, yes's, no's, etc.):
- Make copies of your data and store the master copy away. Use the copy for making edits, cutting and pasting, etc.
- Tabulate the information, i.e., add up the number of ratings, rankings, yes's, and no’s for each question.
- For ratings and rankings, consider computing a mean, or average, for each question. For example, "For question #1, the average ranking was 2.4". This is more meaningful than indicating, e.g., how many respondents ranked 1, 2, or 3.
- Consider conveying the range of answers, e.g., 20 people ranked "1", 30 ranked "2", and 20 people ranked "3".
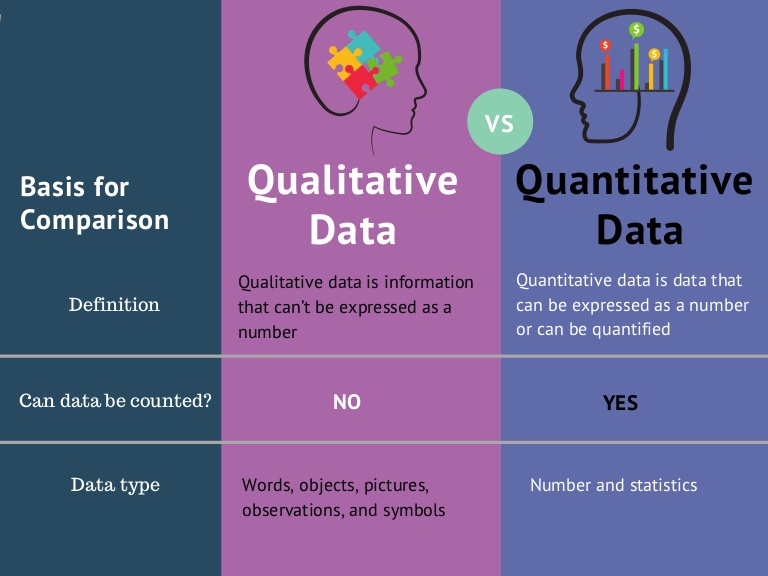
Basic analysis of "qualitative" information (respondents' verbal answers in interviews, focus groups, or written commentary on questionnaires):
- Read through all the data.
- Organize comments into similar categories, e.g., concerns, suggestions, strengths, weaknesses, similar experiences, program inputs, recommendations, outputs, outcome indicators, etc.
- Label the categories or themes, e.g., concerns, suggestions, etc.
- Attempt to identify patterns, or associations and causal relationships in the themes, e.g., all people who attended programs in the evening had similar concerns, most people came from the same geographic area, most people were in the same salary range, what processes or events respondents experience during the program, etc.
- Keep all commentary for several years after completion in case needed for future reference.
Interpreting Information
Attempt to put the information in perspective, e.g., compare results to what you expected, promised results; management or program staff; any common standards for your products or services; original goals (especially if you're conducting a program evaluation); indications or measures of accomplishing outcomes or results (especially if you're conducting an outcomes or performance evaluation); description of the program's experiences, strengths, weaknesses, etc. (especially if you're conducting a process evaluation).
- Consider recommendations to help employees improve the program, product or service; conclusions about program operations or meeting goals, etc.
- Record conclusions and recommendations in a report, and associate interpretations to justify your conclusions or recommendations.
Click here to view a video that explains analyzing and interpreting data.
Reporting Results
- The level and scope of content depends on to whom the report is intended, e.g., to funders / bankers, employees, clients, customers, the public, etc.
- Be sure employees had a chance to carefully review and discuss the report. Translate recommendations to action plans, including who is going to do what about the research results and by when.
- Be sure to record the research plans and activities in a research plan which can be referenced when a similar research effort is needed in the future.
Click here to view a video that explains writing the results section for research papers.
Contents of a Research Report - An Example
Ensure your research plan is documented so that you can regularly and efficiently carry out your research activities. In your plan, record enough information so that someone outside of the organization can understand what you're researching and how. For example, consider the following format:
- Title Page (name of the organization that is being, or has a product/service/ program that is being, researched; date)
- Table of Contents
- Executive Summary (one-page, concise overview of findings and recommendations)
- Purpose of the Report (what type of research was conducted, what decisions are being aided by the findings of the research, who is making the decision, etc.)
- Background About Organization and Product/Service/Program that is being researched
1. Organization Description/History
2. Product/Service/Program Description (that is being researched)
Problem Statement (in the case of non-profits, description of the community need that is being met by the product/service/program)
Overall Goal(s) of Product/Service/Program
Outcomes (or client/customer impacts) and Performance Measures (that can be measured as indicators toward the outcomes)
Activities/Technologies of the Product/Service/Program (general description of how the product/service/program is developed and delivered)
Staffing (description of the number of personnel and roles in the organization that are relevant to developing and delivering the product/service/program)
Overall Evaluation Goals (e.g., what questions are being answered by the research)
Methodology
Types of data/information that were collected
How data/information were collected (what instruments were used, etc.)
How data/information were analysed
Limitations of the evaluation (e.g., cautions about findings/conclusions and how to use the findings/conclusions, etc.)
Interpretations and Conclusions (from analysis of the data/ information)
Recommendations (regarding the decisions that must be made about the product/service/program)
Appendices
Content of the appendices depends on the goals of the research report, e.g.:
- Instruments used to collect data/information
- Data, e.g., in tabular format, etc.
- Testimonials, comments made by users of the product/service/program
- Case studies of users of the product/service/program
- Any related literature
Some Pitfalls to Avoid
- Don't balk at research because it seems far too "scientific." It's not. Usually the first 20% of effort will generate the first 80% of the plan, and this is far better than nothing.
- There is no "perfect" research design. Don't worry about the research design being perfect. It's far more important to do something than to wait until every last detail has been tested.
- Work hard to include some interviews in your research methods. Questionnaires don't capture "the story," and the story is usually the most powerful depiction of the benefits of your products, services, programs, etc.
- Don't interview just the successes. You'll learn a great deal by understanding its failures, dropouts, etc.
- Don't throw away research results once a report has been generated. Results don't take up much room, and they can provide precious information later when trying to understand changes in the product, service or program.
Conclusions and Recommendations

Click here to view a video that explains how to write the conclusion and recommendations.
Although you may have learned in other writing classes that summaries are appropriate conclusions for papers, summaries are typically offered as front matter (prefatory material) in research documents. Therefore, a summary is a weak, redundant ending for a research document. You may, of course, offer a few summary statements to orientate your reader, but effective conclusions do far more than recap information you have already offered in the prefatory material, the introduction, and the discussion of your document.
These endings are all based on the idea that you should draw conclusions, not just conclude. In short, they depend on your explaining “What does this mean for us?” One of the most useful conclusions for many workplace documents is a section offering recommendations or solutions. Such a conclusion is most typically used for problem/solution reports, but it can also be used for cause/effect, comparison/ contrast, and other organizational schemes. In this section, you may recommend which of several solutions is most likely to solve the problem, is most feasible, or is least disruptive.
Although instincts are important in the workplace, a reader will rarely be satisfied that they are the best grounds on which to base important decisions. Thus, you must explain the criteria on which your recommendations are based. Furthermore, your criteria must match the reader’s expectations and needs. Imagine how embarrassing it would be to offer recommendations based on a sense of urgency and moving from immediate-to-remote implementation stages when your readers think your recommendations are based on costs. In other words, you might lose all your credibility if you have proposed an expensive plan because it offers the most immediate relief for the problem, but your readers expect you to offer the most cost-efficient plan.
Your recommendations may correspond to the following criteria:
- Costs or other budget matters
- The mission of the organization
- Space
- Human Resources needs
- Deadlines (legal, business, environmental, or other forms of deadlines)
- Tax structures
- Immediate-to-remote implementation schedules
- Equipment or technological needs
- Materials availability
- Locations