Page
Break-Even Analysis
Completion requirements
View
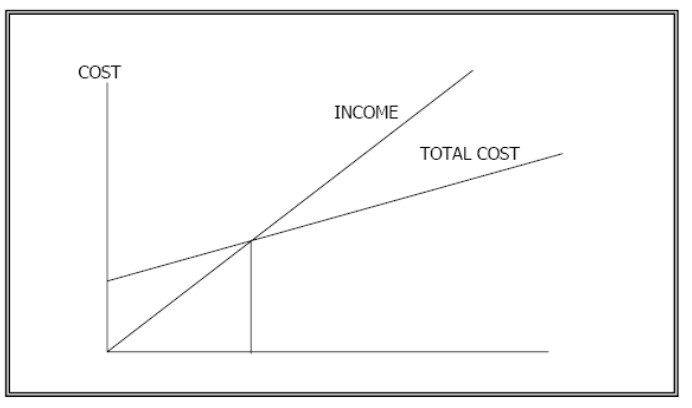
The break-even point is that point in the volume of manufacture and sales where the total income derived from the sales of the product equals the total costs. No profit or loss is made at this specific volume.
When an entrepreneur wishes to start a new business, he will try his best to increase the production and sales volume to such a level that the break-even point can be passed as soon as possible. It is interesting to note that once the break-even point is passed, companies with a high fixed cost structure will have a drastic increase in net profits. This happens because the fixed costs cause total costs to increase at a much slower rate for increasing volumes, resulting in a higher rate of increase for net profits. The break-even can be established graphically or arithmetically.
The Graphical Method
The graphical method could be illustrated as follows:
Mathematical Method
In order to calculate the break-even point of a business mathematically, it is necessary to determine the gross income % of the business or marginal income per unit.
Example:
| Total | Per Unit | |
| Sales (100 000 units) | R 200 000 | R 2.00 |
| Less variable cost | R 120 000 | R 1.20 |
| Marginal Income | R 80 000 | R 0.80 |
| Less: Fixed Cost | R 20 000 | R0.20 |
| Net income | R 60 000 | R0.60 |
The marginal income ratio is calculated as follows:
Marginal income ratio = marginal income ÷ income
R 80 000 ÷ 200 000 = 0.4 or 40%
The ratio can now be used to calculate the break-even point.
Break-even point in units = Tot fixed cost ÷ marginal income per unit
= R 20 000 ÷ R 0.80 = 25 000 units
Break-even point in rand = Tot fixed cost ÷ marginal income
= R 20 000 ÷ 40% = R 50 000.00
Click here to view a video that explains the Break-Even Analysis.