Page
Advantages and Limitations of Gantt Charts
Completion requirements
View
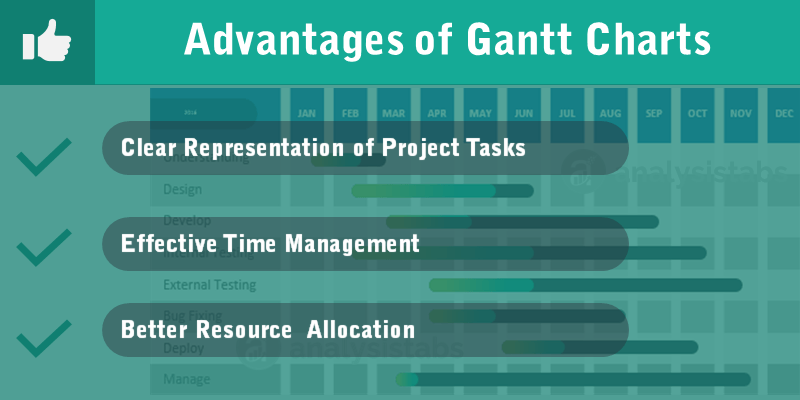
Gantt charts have become a common technique for representing the phrases and activities of a project Work Breakdown Structure (WBS), so they can be understood by a wide audience.
A common error made by those who equate Gantt chart design with project design is that they attempt to define the project work breakdown structure at the same time that they define scheduled activities. This practice makes it very difficult to follow the 100% rule. Instead, when the WBS is fully defined to follow the 100% rule, the project schedule can be designed.
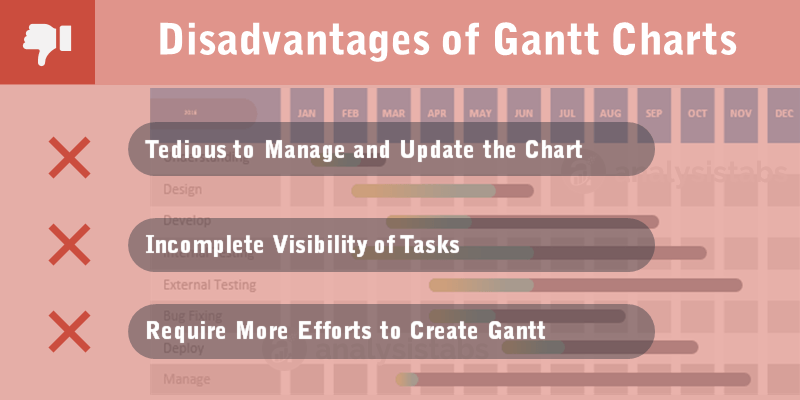
Although a Gantt chart is easily comprehended for small projects that fit on a single sheet or screen, they can become quite unwieldy for projects with more than about 30 activities. Larger Gantt charts may not be suitable for most computer displays. A related criticism is that Gantt charts communicate relatively little information per unit area of the display. That is, projects are often considerably more complex than can be communicated effectively with a Gantt chart.
Gantt charts only represent part of the triple constraints of projects, because they focus primarily on the schedule management. Moreover, Gantt charts do not represent the size of the project or the relative size of work elements, therefore the magnitude of the behind-schedule condition is easily miss-communicated. If two projects are the same number of days behind schedule, the larger project has a larger impact on resource utilisation, yet the Gantt does not represent this difference.
Although project management software can show schedule dependencies as lines between activities, displaying a large number of dependencies may result in a cluttered or unreadable chart.
Because the horizontal bars of a Gantt chart has a fixed height, they can misrepresent the time-phased workload (resource requirements) of a project. A related criticism is that all activities of a Gantt chart show the planned workload as constant. In practice, many activities (especially summary elements) have front-loaded or back-loaded work plans, so a Gantt chart with percent complete shading may actually miss-communicate the true performance status.