Page
Past Experience Relating To Income And Costs
Completion requirements
View
Past experience relating to income and costs are used to project future activities and make changes to a current budget.
To monitor your organisation’s actual performance against the budgeted performance it is necessary that you keep every record and document from every activity every month. The actual performance compared with the budgeted performance will give you both positive and negative variances as we have described. We now need to use the information that we have so that we can project the ongoing effects of these variances or how things will change if we take corrective action.
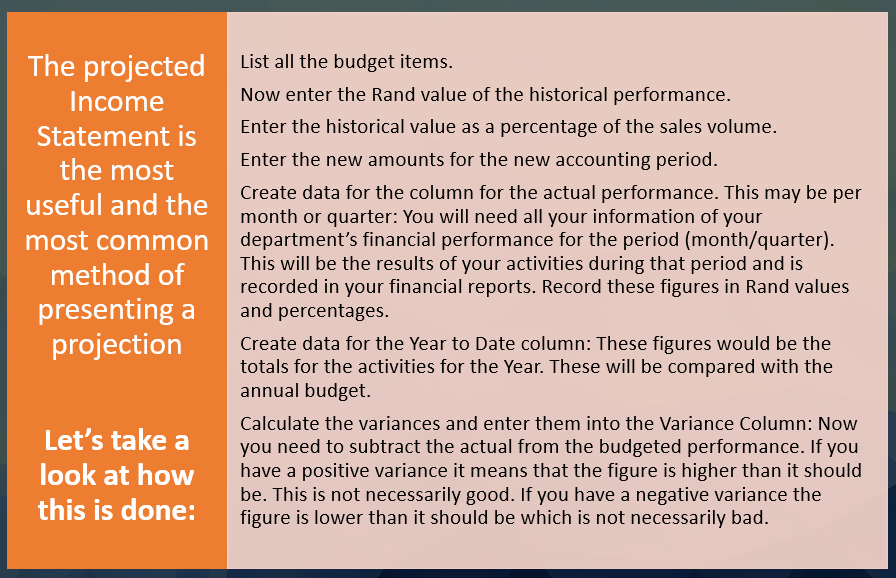
The projected Income Statement is the most useful and the most common method of presenting a projection. This may be a single projection for the business as a whole or it could be split into various areas of responsibility.
Let’s take a look at how this is done:
The preparation requires seven steps, four of which would usually be carried out by the finance department. You would then be given a form and a blank template to complete for the balance of the document.
It could be that you are using a manual system. If so, the negative variance should be shown in brackets, for instance: (R3000.00). Should you be using a computerised version, the software would show the variance either in black with a minus sign in front of it or in red with a minus sign in front of it.
It is important to investigate a variance to find the cause and take the necessary corrective action.
|
Projected Income Statement: January to December 2005 |
||||||||
|
Item |
Jan 2004 R |
% of sales |
Budget Jan 2005 R |
% of sales |
Actual 2005 R |
% of sales |
YTD R |
Variance R |
|
Sales |
500 000 |
100 |
400 000 |
100 |
500 000 |
100 |
500 000 |
100 000 |
|
|
100 000 |
20 |
67 000 |
16.75 |
98 000 |
19.60 |
98 000 |
31 000 |
|
GP |
400 000 |
80 |
233 000 |
83.25 |
402 000 |
80.40 |
402 000 |
69 000 |
|
Selling Expenses |
50 000 |
10 |
40 000 |
10 |
50 000 |
10 |
50 000 |
10 000 |
|
Operating Profit |
350 000 |
70 |
293 000 |
73.25 |
352 000 |
70.40 |
352 000 |
59 000 |