Page
Introduction
Completion requirements
View
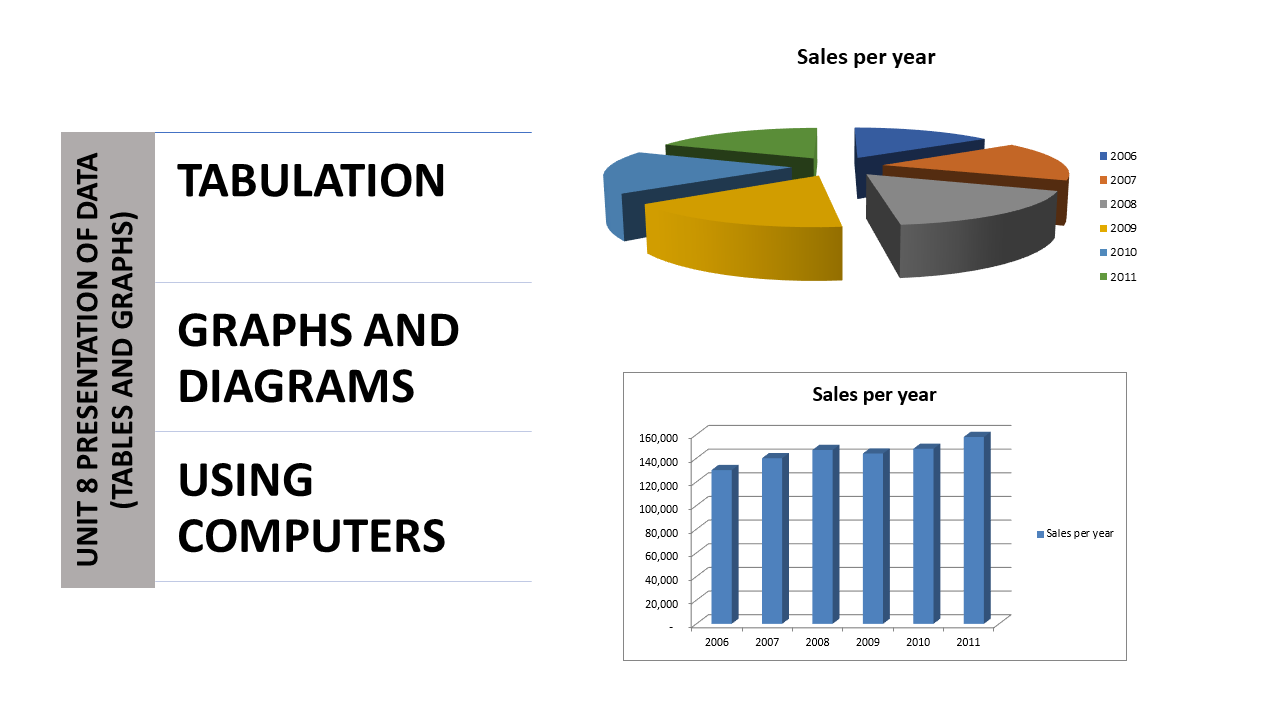
Once data is collected, it must be organised and condensed into manageable proportions, because we are concerned with the overall picture rather than the large collection of pieces.
The raw data must be arranged and displayed in a format that captures readers’ attention and is easy to read and analyse. Thanks to personal computing, information can be displayed visually with relative ease.
The stages you have to go through are:
- Order the data into a logical sequence.
- Summarise it by grouping it into manageable portions.
- Present it in a clear and attractive way by arranging data in the form of a table and then bring the figures to life by using some illustration.
The type of presentation depends on the type of data, complexity of data and the requirements of the user. Major principles of visual data presentation are:
- Approved methods should be used to confirm the reality and truthfulness of the presentation so that the reader can interpret it correctly.
- The presentation must be as simple as possible so that the reader may understand it quickly and easily.
- The presentation must interest the reader and contain worthwhile information.
- An explanation should be included in the text in order to help the reader understand the purpose of the presentation.