Page
Graphs And Diagrams
Completion requirements
View
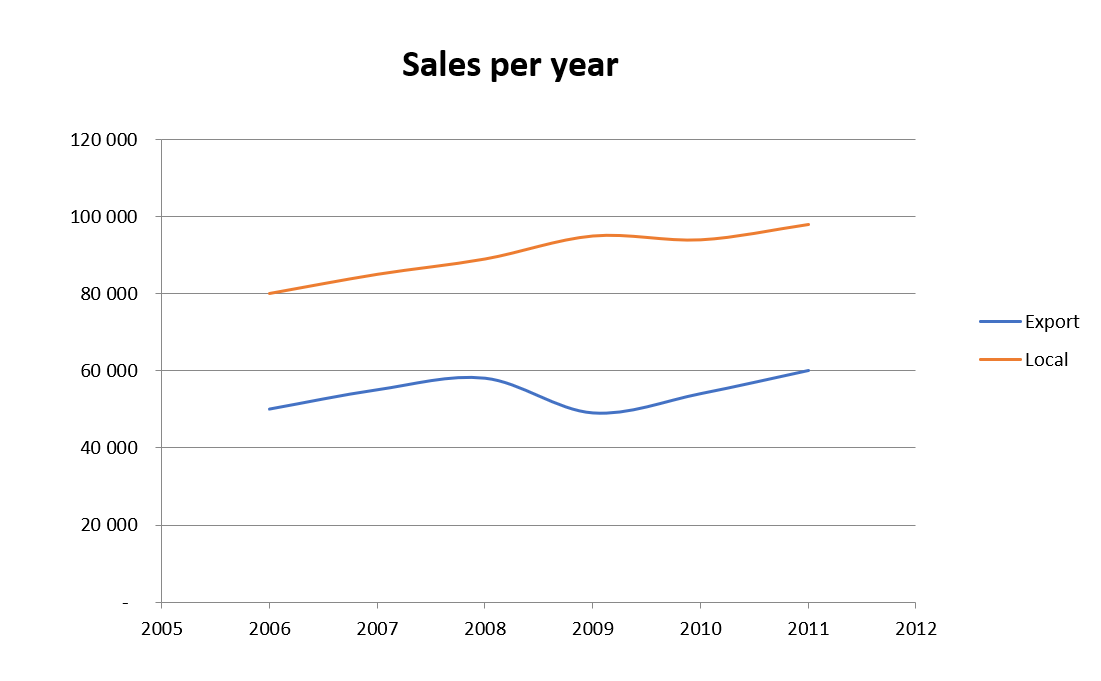
A graph shows the relationship between two variables – the X-variable on the horizontal axis and the Y-variable on the vertical axis. A graph does not replace a table but complements it by showing the data’s general structure more clearly and revealing trends or relationships that might be overlooked in a table. It is more likely to catch the attention of the casual observer. The type of graph depends on the type of data, the complexity of the data and the requirements of the user.
Graphs Based on Discrete Variables
A set of data is discrete if we are required to make a count.
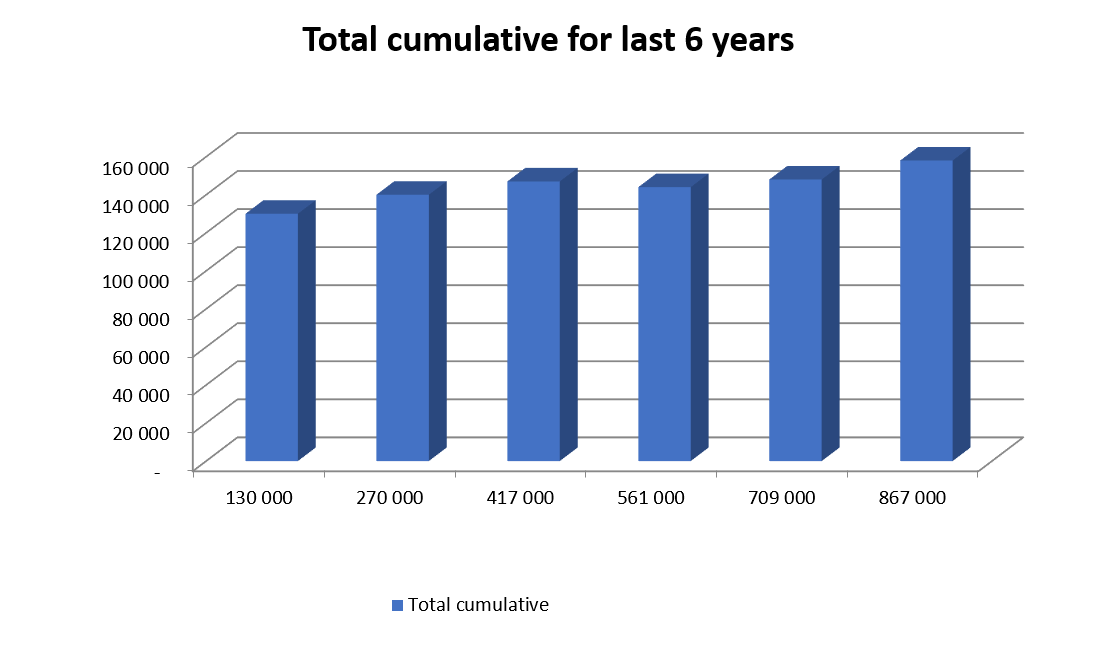
Bar charts are a quick and easy way of showing variation in or between variables. Types of bar charts are shown in the examples below.
Examples of Bar Charts:

Single Bar Chart

Stacked Bar Chart

Percentage Component Bar Chart

Multiple Bar Chart
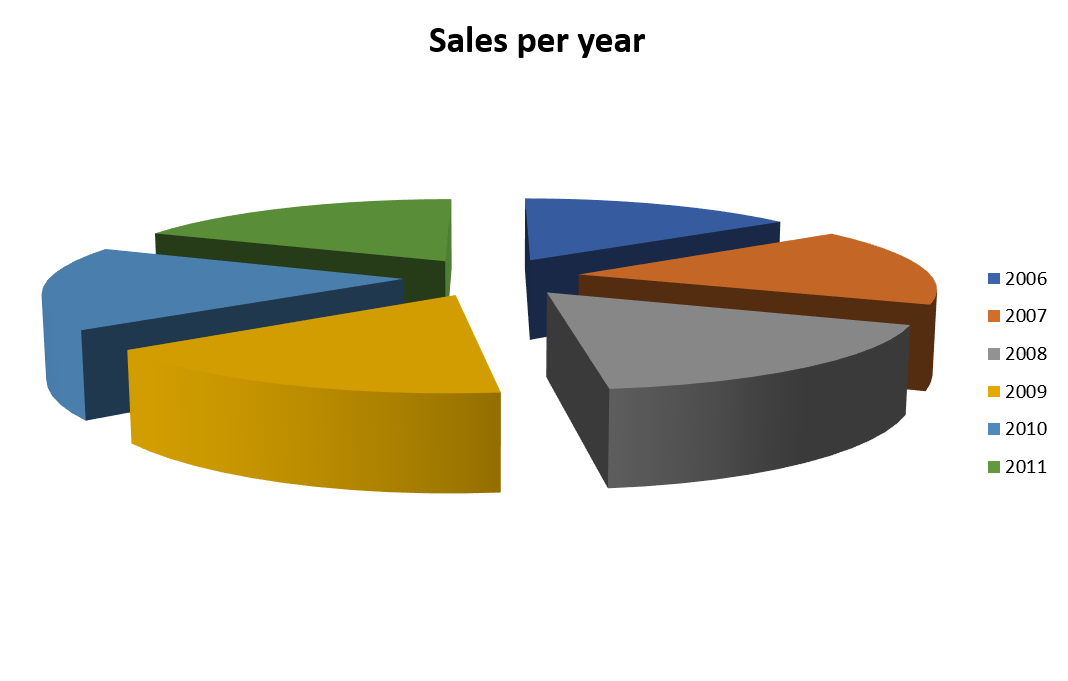
Pie Charts
Graphs Based on Continuous Variables
Continuous data is the result of measurements made with a measuring device. The distribution of measurements is represented by frequency distribution and may be graphed in the three ways explained below:
Examples of Graphs based on continuous variables:
Histogram

Polygon
Ogive/Cumulative Curve
Using Computers
Computers reduce the time needed to process data. There are software packages which calculate totals, averages, percentages, etc. and which can also lay out information on tables, graphs, etc. A good grasp of Excel can assist you to a great extend to do the basics of statistics with ease.