Page
Explaining Correlation and Regression
Completion requirements
View
Financial variables are often analysed for their correlation to other variables and/or market averages. The relative degree of co-movement can serve as a powerful predictor of future behaviour of that variable.
sample covariance and correlation coefficient are tools used to indicate relation, while a linear regression is a technique designed both to quantify a positive relationship between random variables and prove that one variable is dependent on another variable. When you are analysing a security, if returns are found to be significantly dependent on a market index or some other independent source, then both return, and risk can be better explained and understood.
Click here to view a video that explains an intro the Correlation and Regression.
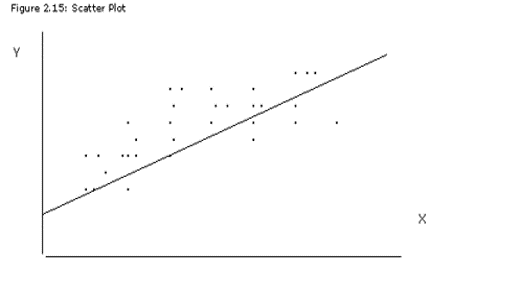
Scatter Plots
A scatter plot is designed to show a relationship between two variables by graphing a series of observations on a two-dimensional graph - one variable on the X-axis, the other on the Y-axis.
Click here to view a video that explains Scatter Plots.
Sample: Covariance
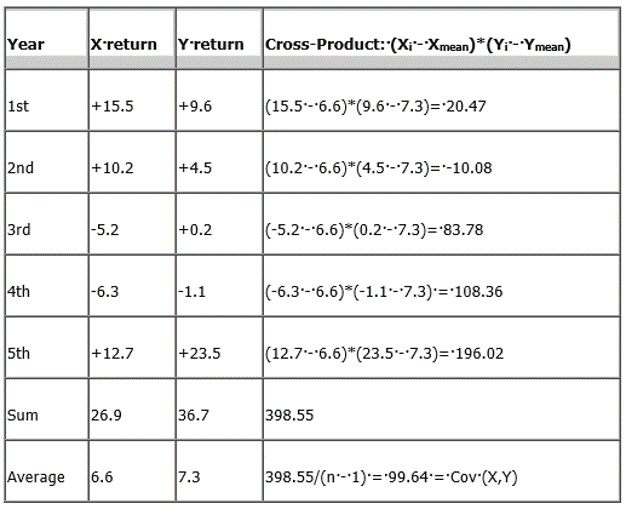
To quantify a linear relationship between two variables, we start by finding the covariance of a sample of paired observations. A sample covariance between two random variables X and Y is the average value of the cross-product of all observed deviations from each respective sample mean. A cross-product, for the ith observation in a sample, is found by this calculation: (ith observation of X - sample mean of X) * (ith observation of Y - sample mean of Y). The covariance is the sum of all cross-products, divided by (n - 1).
To illustrate, take a sample of five paired observations of annual returns for two mutual funds, which we will label X and Y:
Source: http://www.investopedia.com
Average X and Y returns were found by dividing the sum by n or 5, while the average of the cross-products is computed by dividing the sum by n - 1, or 4. The use of n - 1 for covariance is done by statisticians to ensure an unbiased estimate.
Interpreting a covariance number is difficult for those who are not statistical experts. The 99.64 we computed for this example has a sign of "returns squared" since the numbers were percentage returns, and a return squared is not an intuitive concept. The fact that Cov(X, Y) of 99.64 was greater than 0 does indicate a positive or linear relationship between X and Y. Had the covariance been a negative number, it would imply an inverse relationship, while 0 means no relationship. Thus 99.64 indicates that the returns have positive co-movement (when one moves higher so does the other) but doesn't offer any information on the extent of the co-movement.
Click here to view a video that explains Part 1 of Covariance.
Click here to view a video that explains Part 2 of Covariance.